Financial Position
Financial position of the Group
The Volkswagen Group’s gross cash flow amounted to €32.7 billion in fiscal year 2017, 25.5% more than in the previous year. At €−33.8 (−16.6) billion, the change in working capital was significantly negative. As expected, there were high cash outflows in connection with the diesel issue in the reporting period, primarily resulting from vehicle recalls and legal risks. As a result, cash flows from operating activities decreased by €10.6 billion to €−1.2 billion. The new special items recognized in the reporting period had a negative impact on gross cash flow and a positive effect on the change in working capital.
The Volkswagen Group’s investing activities attributable to operating activities rose to €18.2 billion, 8.5% more than in the previous year. In the reporting period, the “Acquisition and disposal of equity investments” item particularly includes the acquisition of shares in Navistar as well as the sale of part of the PGA Group. The figure for the previous year had mainly been influenced by the cash inflow from the sale of the shares in LeasePlan.
Cash inflows from financing activities amounted to €17.6 (9.7) billion. These primarily include the issuance and redemption of bonds and other financial liabilities. The dual-tranche hybrid notes (€3.5 billion), successfully placed in June 2017, increased net liquidity; this was offset by the dividend paid to the shareholders of Volkswagen AG (€1.0 billion).
At the end of the reporting period, the Volkswagen Group’s cash and cash equivalents as reported in the cash flow statement amounted to €18.0 (18.8) billion and were thus down on the prior-year reporting date.
The Volkswagen Group's net liquidity as of December 31, 2017 was €−119.1 (−107.9) billion.
|
|
(XLS:)
|
CASH FLOW STATEMENT BY DIVISION |
|
|
||||||||||||||||||||||
|---|---|---|---|---|---|---|---|---|---|---|---|---|---|---|---|---|---|---|---|---|---|---|---|---|
|
VOLKSWAGEN GROUP |
AUTOMOTIVE1 |
FINANCIAL SERVICES |
|||||||||||||||||||||
|
||||||||||||||||||||||||
€ million |
2017 |
2016 |
2017 |
2016 |
2017 |
2016 |
||||||||||||||||||
|
|
|
|
|
|
|
||||||||||||||||||
Cash and cash equivalents at beginning of period |
18,833 |
20,462 |
14,125 |
15,294 |
4,709 |
5,168 |
||||||||||||||||||
Earnings before tax |
13,913 |
7,292 |
11,411 |
4,884 |
2,502 |
2,408 |
||||||||||||||||||
Income taxes paid |
−3,664 |
−3,315 |
−3,514 |
−3,526 |
−149 |
211 |
||||||||||||||||||
Depreciation and amortization expense2 |
22,165 |
20,924 |
14,948 |
14,331 |
7,218 |
6,593 |
||||||||||||||||||
Change in pension provisions |
468 |
235 |
452 |
224 |
15 |
11 |
||||||||||||||||||
Other noncash income/expense and reclassifications3 |
−231 |
871 |
121 |
556 |
−352 |
316 |
||||||||||||||||||
Gross cash flow |
32,651 |
26,007 |
23,418 |
16,468 |
9,233 |
9,539 |
||||||||||||||||||
Change in working capital |
−33,836 |
−16,576 |
−11,732 |
3,803 |
−22,104 |
−20,379 |
||||||||||||||||||
Change in inventories |
−4,198 |
−3,637 |
−3,784 |
−3,313 |
−414 |
−324 |
||||||||||||||||||
Change in receivables |
−1,660 |
−2,155 |
−937 |
−1,876 |
−724 |
−280 |
||||||||||||||||||
Change in liabilities |
5,302 |
5,048 |
4,168 |
4,474 |
1,134 |
574 |
||||||||||||||||||
Change in other provisions |
−9,910 |
5,732 |
−10,079 |
5,616 |
169 |
116 |
||||||||||||||||||
Change in lease assets (excluding depreciation) |
−11,478 |
−12,074 |
−1,115 |
−1,157 |
−10,363 |
−10,917 |
||||||||||||||||||
Change in financial services receivables |
−11,891 |
−9,490 |
15 |
58 |
−11,906 |
−9,547 |
||||||||||||||||||
Cash flows from operating activities |
−1,185 |
9,430 |
11,686 |
20,271 |
−12,871 |
−10,840 |
||||||||||||||||||
Cash flows from investing activities attributable to operating activities |
−18,218 |
−16,797 |
−17,636 |
−15,941 |
−583 |
−856 |
||||||||||||||||||
of which: investments in property, plant and equipment, investment property and intangible assets, excluding capitalized development costs |
−13,052 |
−13,152 |
−12,631 |
−12,795 |
−421 |
−357 |
||||||||||||||||||
capitalized development costs |
−5,260 |
−5,750 |
−5,260 |
−5,750 |
– |
– |
||||||||||||||||||
acquisition and disposal of equity investments |
−317 |
1,754 |
−124 |
2,283 |
−193 |
−528 |
||||||||||||||||||
Net cash flow4 |
−19,404 |
−7,367 |
−5,950 |
4,330 |
−13,454 |
−11,696 |
||||||||||||||||||
Change in investments in securities, loans and time deposits |
1,710 |
−3,882 |
2,333 |
−3,125 |
−622 |
−757 |
||||||||||||||||||
Cash flows from investing activities |
−16,508 |
−20,679 |
−15,303 |
−19,066 |
−1,205 |
−1,613 |
||||||||||||||||||
Cash flows from financing activities |
17,625 |
9,712 |
3,562 |
−2,298 |
14,063 |
12,009 |
||||||||||||||||||
of which: capital transactions with noncontrolling interests |
– |
−3 |
– |
−3 |
– |
– |
||||||||||||||||||
Capital contributions/capital redemptions |
3,473 |
– |
2,400 |
−1,454 |
1,073 |
1,454 |
||||||||||||||||||
Effect of exchange rate changes on cash and cash equivalents |
−727 |
−91 |
−641 |
−76 |
−86 |
−15 |
||||||||||||||||||
Net change in cash and cash equivalents |
−796 |
−1,628 |
−696 |
−1,169 |
−99 |
−460 |
||||||||||||||||||
|
|
|
|
|
|
|
||||||||||||||||||
Cash and cash equivalents at Dec. 315 |
18,038 |
18,833 |
13,428 |
14,125 |
4,609 |
4,709 |
||||||||||||||||||
Securities, loans and time deposits |
26,291 |
28,036 |
15,201 |
17,911 |
11,090 |
10,125 |
||||||||||||||||||
Gross liquidity |
44,329 |
46,869 |
28,630 |
32,036 |
15,699 |
14,833 |
||||||||||||||||||
Total third-party borrowings |
−163,472 |
−154,819 |
−6,251 |
−4,856 |
−157,221 |
−149,963 |
||||||||||||||||||
Net liquidity6 |
−119,143 |
−107,950 |
22,378 |
27,180 |
−141,522 |
−135,130 |
||||||||||||||||||
AUTOMOTIVE DIVISION NET CASH FLOW 2017
€ billion
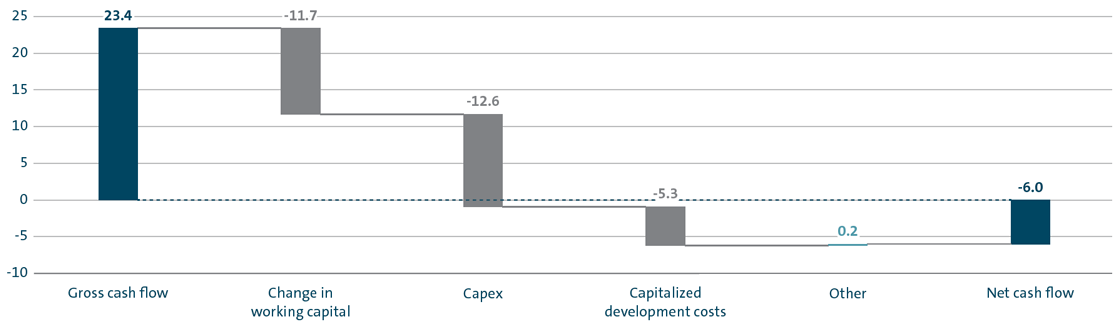
Financial position of the Automotive Division
The Automotive Division's gross cash flow was €23.4 billion in fiscal year 2017, thus exceeding the prior-year figure by €6.9 billion. The increase in operating profit before special items and the year-on-year decline in special items had a positive effect. At €−11.7 (3.8) billion, the change in working capital was significantly negative. As expected, there were high cash outflows in the reporting period related to the diesel issue, primarily for vehicle recalls and legal risks. As a result, cash flows from operating activities amounted to €11.7 billion, €8.6 billion less than in 2016. The new special items recognized in fiscal year 2017 had a negative impact on gross cash flow and a positive effect on the change in working capital.
Investing activities attributable to operating activities increased by €1.7 billion to €17.6 billion. At €12.6 (12.8) billion, investments in property, plant and equipment, investment property and intangible assets, excluding capitalized development costs (capex) were on a level with the previous year. The ratio of capex to sales revenue declined to 6.4 (6.9)% due primarily to the rise in sales revenue. We invested mainly in our production facilities and in models that we launched in the reporting period or are planning to launch next year. These are primarily vehicles in the Polo, Tiguan, Audi A6, Audi A8 and Audi e-tron series, as well as the Audi A4, Porsche Cayenne, Porsche 911 and the Bentley Continental family. Other investment priorities included the ecological focus of our model range, drivetrain electrification and our modular toolkits. At €5.3 (5.8) billion, capitalized development costs were lower than in the previous year. In the reporting period, the “Acquisition and disposal of equity investments” item mainly includes the acquisition of shares in Navistar and the sale of part of the PGA Group. In the prior-year period, the sale of the shares in LeasePlan had a significantly positive effect on this item.
The Automotive Division’s net cash flow reflects the division's strong operating performance, although it declined by €10.3 billion to €−6.0 billion driven, as expected, by high cash outflows attributable to the diesel issue.
A capital increase carried out by Volkswagen AG at Volkswagen Financial Services AG at the beginning of 2017 in order to finance the growth in business volumes and comply with regulatory capital requirements resulted in outflows of €1.0 billion in the Automotive Division’s financing activities. In May 2017, a dividend totaling €1.0 billion was distributed to the shareholders of Volkswagen AG, €0.9 billion more than in the previous year. The successful placement of dual-tranche hybrid notes with an aggregate principal amount of €3.5 billion via Volkswagen International Finance N.V. in June 2017 resulted in a cash inflow. The notes consist of a €1.5 billion note that carries a coupon of 2.7% and has a first call date after five and a half years, and a €2.0 billion note that carries a coupon of 3.875% and has a first call date after ten years. Both tranches are perpetual and increase equity, net of transaction costs, among other factors. The cash inflows from the hybrid notes were classified as a capital contribution, which increased net liquidity. In addition, financing activities include the issuance and redemption of bonds and other financial liabilities. They amounted to €3.6 billion in 2017, €5.9 billion more than in the prior-year period.
On December 31, 2017, the Automotive Division’s net liquidity was again at a robust level of €22.4 billion, compared with €27.2 billion at the end of 2016. The Automotive Division’s net liquidity represents 9.7 (12.5)% of consolidated sales revenue in the reporting period.
| (XLS:)
|
FINANCIAL POSITION IN THE PASSENGER CARS BUSINESS AREA |
||||
|---|---|---|---|---|
€ million |
2017 |
2016 |
||
|
|
|
||
Gross cash flow |
19,410 |
13,920 |
||
Change in working capital |
−10,122 |
3,454 |
||
Cash flows from operating activities |
9,289 |
17,374 |
||
Cash flows from investing activities attributable to operating activities |
−15,337 |
−13,353 |
||
Net cash flow |
−6,048 |
4,021 |
||
In the reporting period, the Passenger Cars Business Area recorded gross cash flow of €19.4 billion, up €5.5 billion on the prior-year figure, mainly due to earnings-related factors; a significant year-on-year decline in negative special items also had a positive effect. The change in working capital was significantly negative, decreasing by €13.6 billion year-on-year to €−10.1 billion. As expected, there were high cash outflows related to the diesel issue in fiscal year 2017, primarily for vehicle recalls and legal risks. Consequently, cash flows from operating activities decreased by 46.5% to €9.3 billion. The new special items recognized in the reporting period had a negative impact on gross cash flow and a positive effect on the change in working capital. Investing activities attributable to operating activities resulted in cash outflows of €15.3 (13.4) billion in the reporting period. The year-on-year increase in capex of €0.3 billion to €11.2 billion was more than offset by the €0.4 billion decline in capitalized development costs to €4.6 billion. The item included the sale of part of the PGA Group in the reporting period; in the prior-year period, the sale of the LeasePlan shares had a significantly positive impact. Net cash flow amounted to €−6.0 (4.0) billion.
| (XLS:)
|
FINANCIAL POSITION IN THE COMMERCIAL VEHICLES BUSINESS AREA |
||||
|---|---|---|---|---|
€ million |
2017 |
2016 |
||
|
|
|
||
Gross cash flow |
3,739 |
2,496 |
||
Change in working capital |
−1,320 |
238 |
||
Cash flows from operating activities |
2,419 |
2,734 |
||
Cash flows from investing activities attributable to operating activities |
−2,122 |
−2,407 |
||
Net cash flow |
297 |
327 |
||
The Commercial Vehicles Business Area generated gross cash flow of €3.7 billion in the reporting period, €1.2 billion above the prior-year figure due to earnings-related factors. At €−1.3 (0.2) billion, the change in working capital was significantly negative. In the prior-year period, the special items recognized had a negative impact on gross cash flow and a positive effect on the change in working capital. Cash flows from operating activities were slightly down on the 2016 figure, declining to €2.4 (2.7) billion. Despite the acquisition of shares in Navistar and investments in a new cab generation at Scania, investing activities attributable to operating activities were down year-on-year, amounting to €2.1 (2.4) billion; the previous year had been affected by investments in the new plant for light commercial vehicles in Wrzesnia in Poland. At €0.3 (0.3) billion, net cash flow was on a level with the previous year.
| (XLS:)
|
FINANCIAL POSITION IN THE POWER ENGINEERING BUSINESS AREA |
||||
|---|---|---|---|---|
€ million |
2017 |
2016 |
||
|
|
|
||
Gross cash flow |
268 |
52 |
||
Change in working capital |
−290 |
111 |
||
Cash flows from operating activities |
−22 |
163 |
||
Cash flows from investing activities attributable to operating activities |
−177 |
−182 |
||
Net cash flow |
−199 |
−19 |
||
In fiscal year 2017, the Power Engineering Business Area’s gross cash flow improved to €0.3 (0.1) billion. Funds tied up in working capital increased by €0.4 billion to €−0.3 billion. The comparison with the prior-year period has to take special items into account. Cash flows from operating activities were down on the previous year, breaking even in the reporting period. At €0.2 (0.2) billion, investing activities attributable to operating activities were on a level with the previous year. Net cash flow declined to €−0.2 (0.0) billion.
Financial position in the Financial Services Division
The Financial Services Division’s gross cash flow declined to €9.2 billion in the reporting period, €0.3 billion lower than in the previous year. Due to larger volumes, funds tied up in working capital increased by €1.7 billion to €22.1 billion. Cash flows from operating activities amounted to €−12.9 (−10.8) billion.
At €0.6 (0.9) billion, investing activities attributable to operating activities were down on the previous year, which had included the acquisition of shares in the ride-hailing service Gett.
The Financial Services Division’s financing activities resulted in cash inflows of €14.1 (12.0) billion in 2017. This included a capital increase of €1.0 billion implemented by Volkswagen AG to finance expected business growth and to comply with stricter regulatory requirements.
At the end of 2017, the Financial Services Division’s negative net liquidity, which is common in the industry, stood at €−141.5 billion, compared with €−135.1 billion at the end of December 2016.